


PAYMENT OPTIONS
![]()

🗓 June 20, 2024. 🕒 10 min read
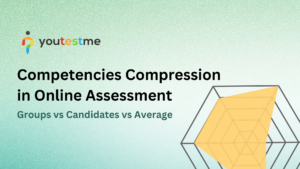
In online assessments, candidate competencies, as well as groups of candidates, can be easily analyzed using the radar chart, a graphical representation of desired variables. This tool is particularly significant in the HR industry, as it enables HR professionals and candidates to identify areas of strong proficiency as well as those that require improvement.
A radar chart, also known as a spider chart or web chart, is a graphical method of displaying multivariate data in the form of a two-dimensional chart. It consists of a series of axes radiating from a central point, each representing one variable. The data points are plotted on these axes and connected to form a polygon, providing a clear visual representation of performance across multiple metrics.
Radar charts offer a unique advantage in visualizing complex data sets, making them an ideal choice for enhancing the analytics capabilities of YouTestMe. Here’s how radar charts can be leveraged within the platform:
Radar charts are excellent for comparing multiple students or groups. By overlaying multiple polygons on the same chart, administrators can easily compare the performance of different students, classes, or even schools. This can be particularly useful for identifying patterns and trends, such as which groups may need additional support or which teaching methods are yielding the best results.
Beyond academic subjects, radar charts can be used to assess a wide range of skills and competencies. For instance, in professional certification exams, different competencies such as problem-solving, analytical thinking, and technical skills can be evaluated. This feature provide a clear visual of how well candidates perform in each competency, aiding in targeted skill development.
Once candidates finish the exam, they will be able to access the radar chart by opening the “Charts” tab in their personal reports.
This preview can motivate candidates by clearly showing their progress and can also help them adjust their strategies based on the data. Tracking progress over time becomes straightforward. You can plot performance data from different time periods on the same chart to visualize growth and improvement.
Tracking candidates’ competences in YouTestMe can be done seamlessly with a few strategic steps:
Data Collection
YouTestMe collects detailed performance data across various metrics. This could include scores in different subjects, individual question performance, time taken to complete exams, comparisons and more.
Data Visualization
YouTestMe’s Radar Chart can help you to express your data visually and improve the reporting experience.
User Interface
Design the user interface to allow easy access to radar charts after finishing the assessments.
Radar charts represent a significant leap forward in the analytical capabilities of online exam software like YouTestMe. So, if you’re looking to unlock deeper insights and drive better results, consider integrating radar charts into your analytics toolkit. The added layer of analysis can make a world of difference in understanding and enhancing student performance.
If you are interested in seeing how the testing process and reporting with a radar chart would look, request your YouTestMe free trial today.
Overall, it’s a powerful tool for reporting during online assessments!
![]()

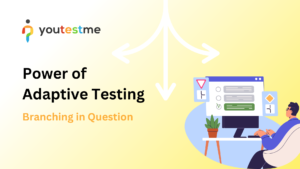
 Power of Adaptive Testing: Branching in Question
Experience YouTestMe proctored test!
Please enter your name and email to get a free test attempt.
After completing the test, you can check out the report with your final results.
Disclaimer:
Please note that all your data will be detailed immediately upon the completion of the test. No records will be stored.
Your First-Hand YouTestMe Experience
Please enter your name and email to get a free test attempt.
After completing the test, you can check out the report with your final results.
Your First-Hand YouTestMe Experience
Please enter your name and email to get a free test attempt.
After completing the test, you can check out the report with your final results.
Your First-Hand YouTestMe Experience
Please enter your name and email to get a free test attempt.
After completing the test, you can check out the report with your final results.
Your First-Hand YouTestMe Experience
Please enter your name and email to get a free test attempt.
After completing the test, you can check out the report with your final results.
Your First-Hand YouTestMe Experience
Please enter your name and email to get a free test attempt.
After completing the test, you can check out the report with your final results.
Your First-Hand YouTestMe Experience
Please enter your name and email to get a free test attempt.
After completing the test, you can check out the report with your final results.
Your First-Hand YouTestMe Experience
Please enter your name and email to get a free test attempt.
After completing the test, you can check out the report with your final results.
Your First-Hand YouTestMe Experience
Please enter your name and email to get a free test attempt.
After completing the test, you can check out the report with your final results.
Your First-Hand YouTestMe Experience
Please enter your name and email to get a free test attempt.
After completing the test, you can check out the report with your final results.
Your First-Hand YouTestMe Experience
Please enter your name and email to get a free test attempt.
After completing the test, you can check out the report with your final results.
Your First-Hand YouTestMe Experience
Please enter your name and email to get a free test attempt.
After completing the test, you can check out the report with your final results.
Your First-Hand YouTestMe Experience
Please enter your name and email to get a free test attempt.
After completing the test, you can check out the report with your final results.
Your First-Hand YouTestMe Experience
Please enter your name and email to get a free test attempt.
After completing the test, you can check out the report with your final results.
Your First-Hand YouTestMe Experience
Please enter your name and email to get a free test attempt.
After completing the test, you can check out the report with your final results.
Your First-Hand YouTestMe Experience
Please enter your name and email to get a free test attempt.
After completing the test, you can check out the report with your final results.
Your First-Hand YouTestMe Experience
Please enter your name and email to get a free test attempt.
After completing the test, you can check out the report with your final results.
Your First-Hand YouTestMe Experience
Please enter your name and email to get a free test attempt.
After completing the test, you can check out the report with your final results.
Your First-Hand YouTestMe Experience
Please enter your name and email to get a free test attempt.
After completing the test, you can check out the report with your final results.
Your First-Hand YouTestMe Experience
Please enter your name and email to get a free test attempt.
After completing the test, you can check out the report with your final results.
Your First-Hand YouTestMe Experience
Please enter your name and email to get a free test attempt.
After completing the test, you can check out the report with your final results.
Your First-Hand YouTestMe Experience
Please enter your name and email to get a free test attempt.
After completing the test, you can check out the report with your final results.
Your First-Hand YouTestMe Experience
Please enter your name and email to get a free test attempt.
After completing the test, you can check out the report with your final results.
Your First-Hand YouTestMe Experience
Please enter your name and email to get a free test attempt.
After completing the test, you can check out the report with your final results.
Your First-Hand YouTestMe Experience
Please enter your name and email to get a free test attempt.
After completing the test, you can check out the report with your final results.
Your First-Hand YouTestMe Experience
Please enter your name and email to get a free test attempt.
After completing the test, you can check out the report with your final results.
Your First-Hand YouTestMe Experience
Please enter your name and email to get a free test attempt.
After completing the test, you can check out the report with your final results.
Your First-Hand YouTestMe Experience
Please enter your name and email to get a free test attempt.
After completing the test, you can check out the report with your final results.
Your First-Hand YouTestMe Experience
Please enter your name and email to get a free test attempt.
After completing the test, you can check out the report with your final results.
Your First-Hand YouTestMe Experience
Please enter your name and email to get a free test attempt.
After completing the test, you can check out the report with your final results.
Your First-Hand YouTestMe Experience
Please enter your name and email to get a free test attempt.
After completing the test, you can check out the report with your final results.
Your First-Hand YouTestMe Experience
Please enter your name and email to get a free test attempt.
After completing the test, you can check out the report with your final results.
Your First-Hand YouTestMe Experience
Please enter your name and email to get a free test attempt.
After completing the test, you can check out the report with your final results.
Please enter your name and email to get a free test attempt.
After completing the test, you can check out the report with your final results.
Please enter your name and email to get a free test attempt.
After completing the test, you can check out the report with your final results.
Please enter your name and email to get a free test attempt.
After completing the test, you can check out the report with your final results.
Please enter your name and email to get a free test attempt.
After completing the test, you can check out the report with your final results.
Please enter your name and email to get a free test attempt.
After completing the test, you can check out the report with your final results.
Please enter your name and email to get a free test attempt.
After completing the test, you can check out the report with your final results.
Please enter your name and email to get a free test attempt.
After completing the test, you can check out the report with your final results.
Please enter your name and email to get a free test attempt.
After completing the test, you can check out the report with your final results.
Please enter your name and email to get a free test attempt.
After completing the test, you can check out the report with your final results.
Please enter your name and email to get a free test attempt.
After completing the test, you can check out the report with your final results.
Please enter your name and email to get a free test attempt.
After completing the test, you can check out the report with your final results.
Please enter your name and email to get a free test attempt.
After completing the test, you can check out the report with your final results.
Please enter your name and email to get a free test attempt.
After completing the test, you can check out the report with your final results.
Please enter your name and email to get a free test attempt.
After completing the test, you can check out the report with your final results.
Please enter your name and email to get a free test attempt.
After completing the test, you can check out the report with your final results.
Please enter your name and email to get a free test attempt.
After completing the test, you can check out the report with your final results.