The YouTestMe platform offers powerful and flexible reporting tools designed to analyze exam results across multiple dimensions. These capabilities are tailored to meet the diverse needs of organizations seeking advanced insights into testing performance. Whether at the test level, question level, individual user level, or group level, YouTestMe’s reporting features provide actionable data to support informed decision-making.
Summary Report #
For every test created in the system, a detailed summary report is accessible through the Reports tab. This report presents a global overview of testing performance, offering summarized statistics of test attempt scores and progress. Key insights include a breakdown of results by testing sessions and locations, ensuring that users can evaluate performance trends effectively.
Attempts Summary Report #
The Attempts Summary Report offers a comprehensive analysis of test attempt data. Users can access the following metrics:
- Total Number of Candidates: The total participants in the test.
- Pass/Fail Statistics: Counts of passed and failed attempts.
- Progress Metrics: Numbers of started and completed attempts.
- Score Analysis: Average, lowest, highest, and median scores, alongside standard deviation.
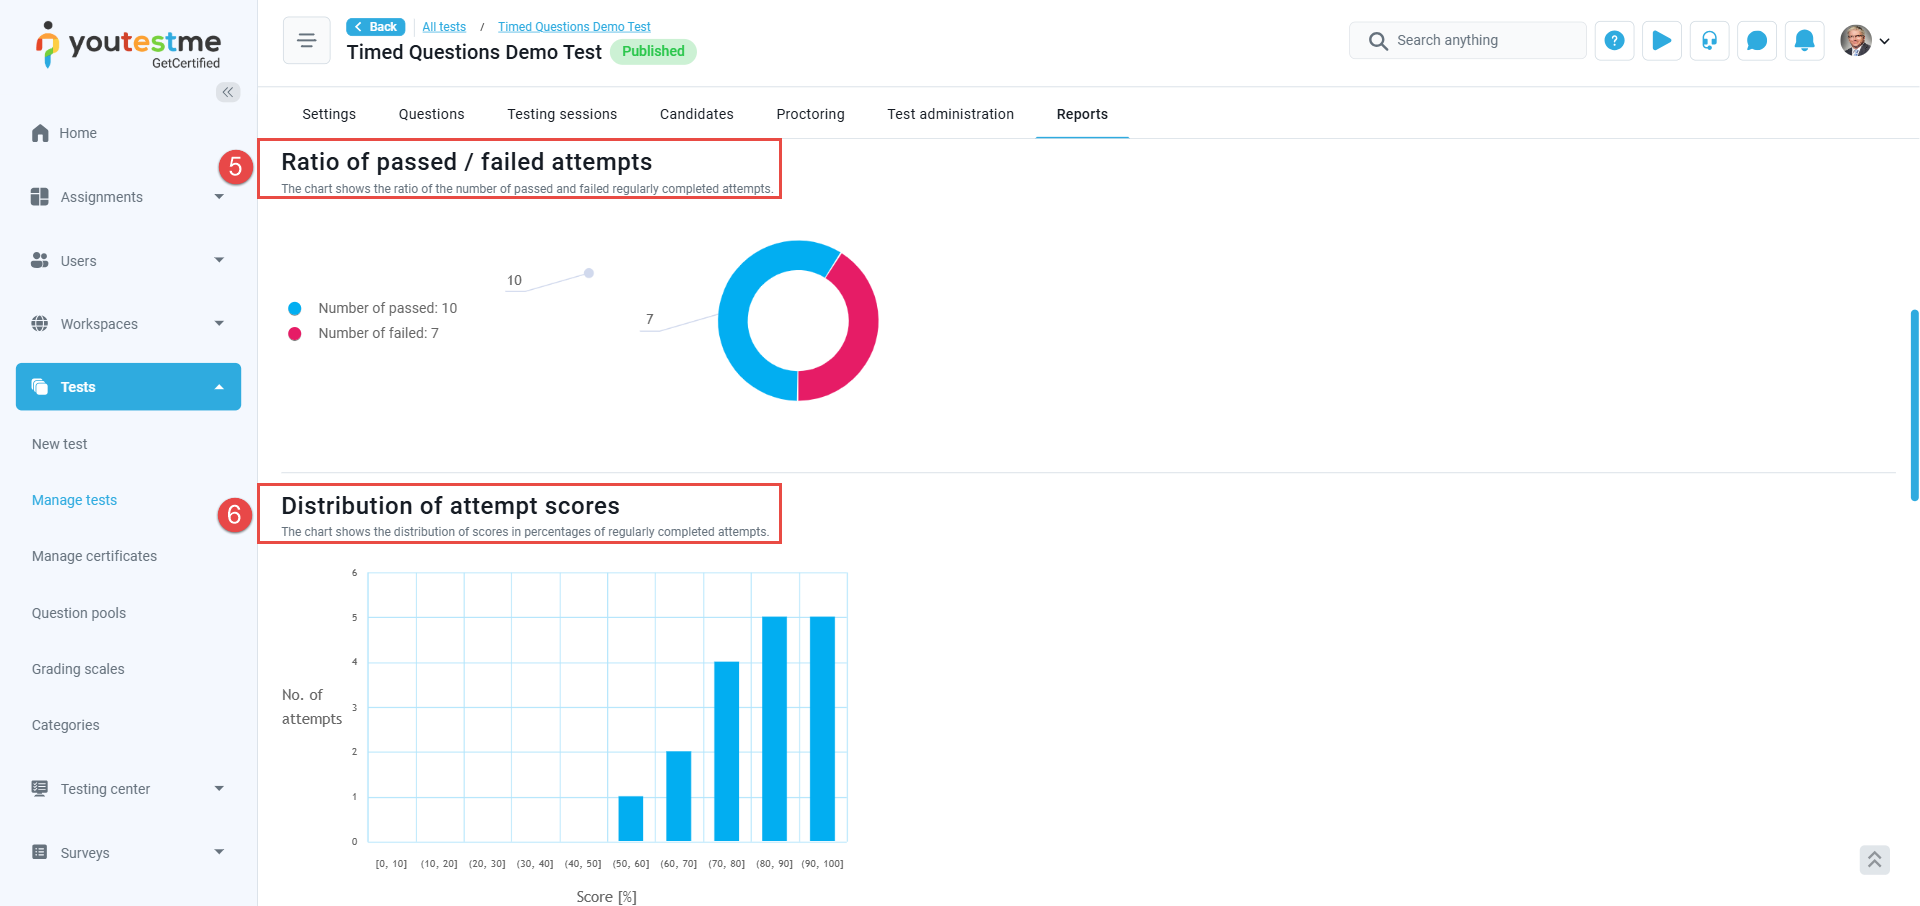
- Ratio of passed / failed attempts: A visual chart illustrating the ratio of passed and failed regularly completed attempts.
- Distribution of attempt scores: A chart showing the distribution of scores as percentages of regularly completed attempts.
 #
#
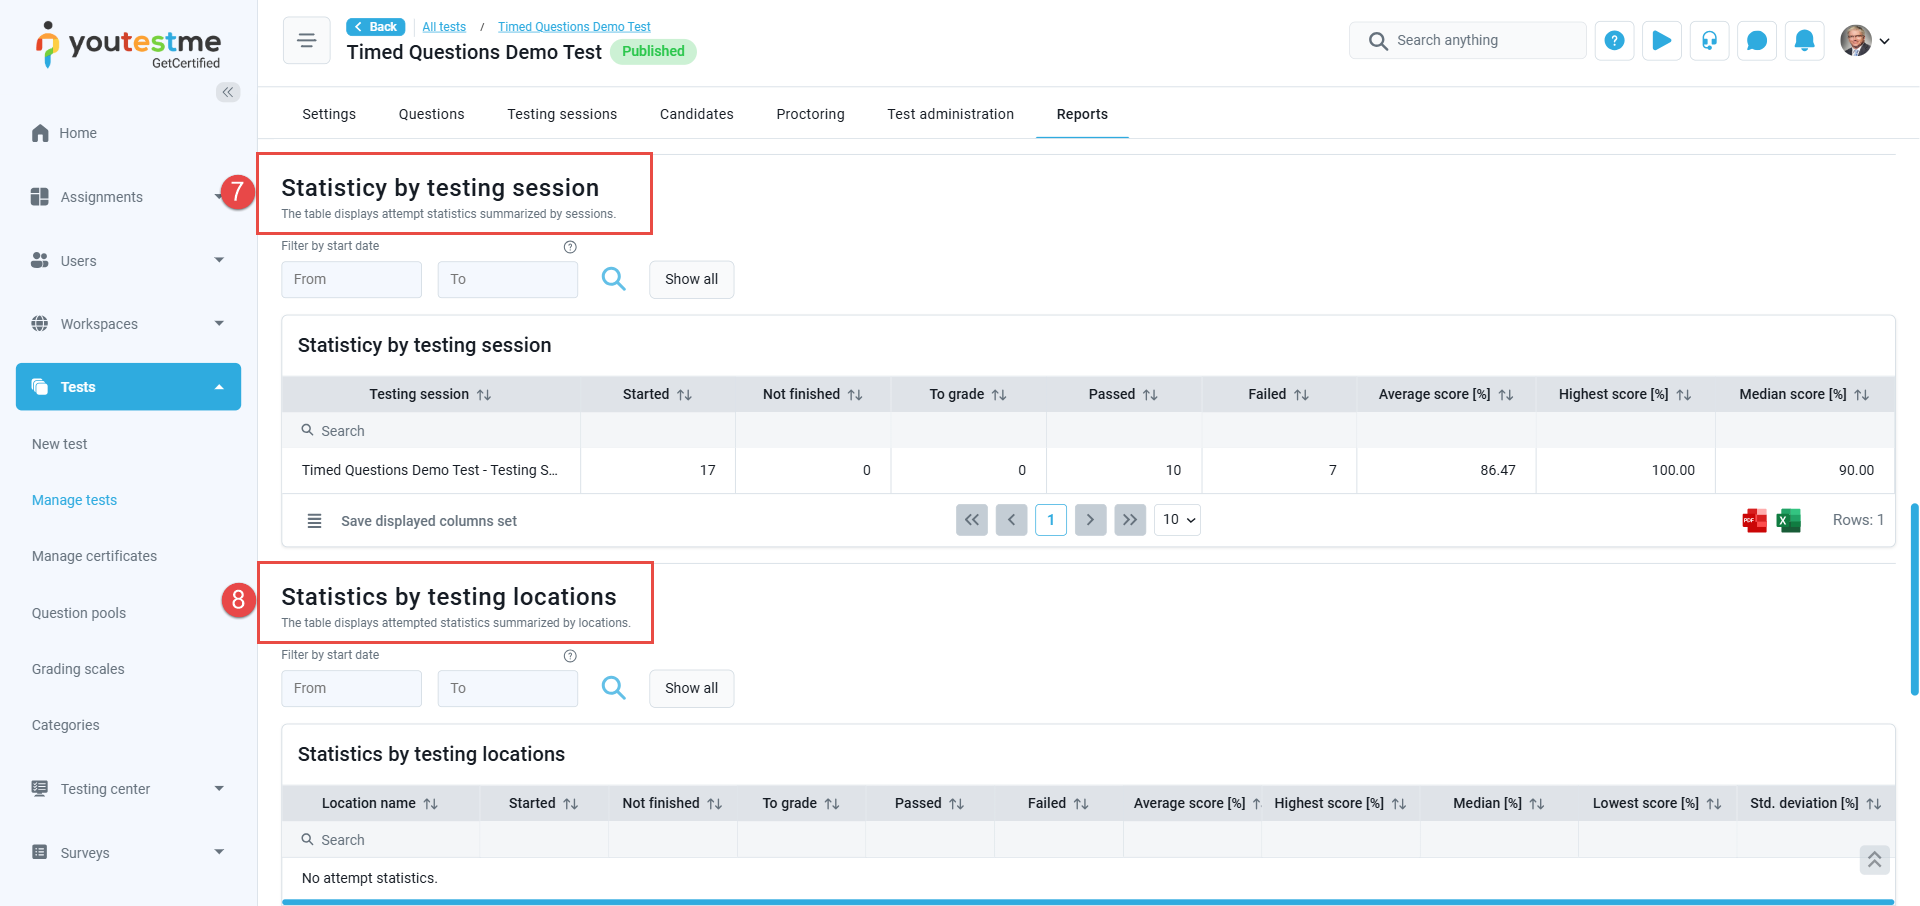
- Statistics by Testing Session: A comparative table summarizing attempt statistics by sessions. Users can display all the test sessions or filter by date.
- Statistics by Testing Location: A similar table displays summarized results categorized by testing location.
Report Builder #
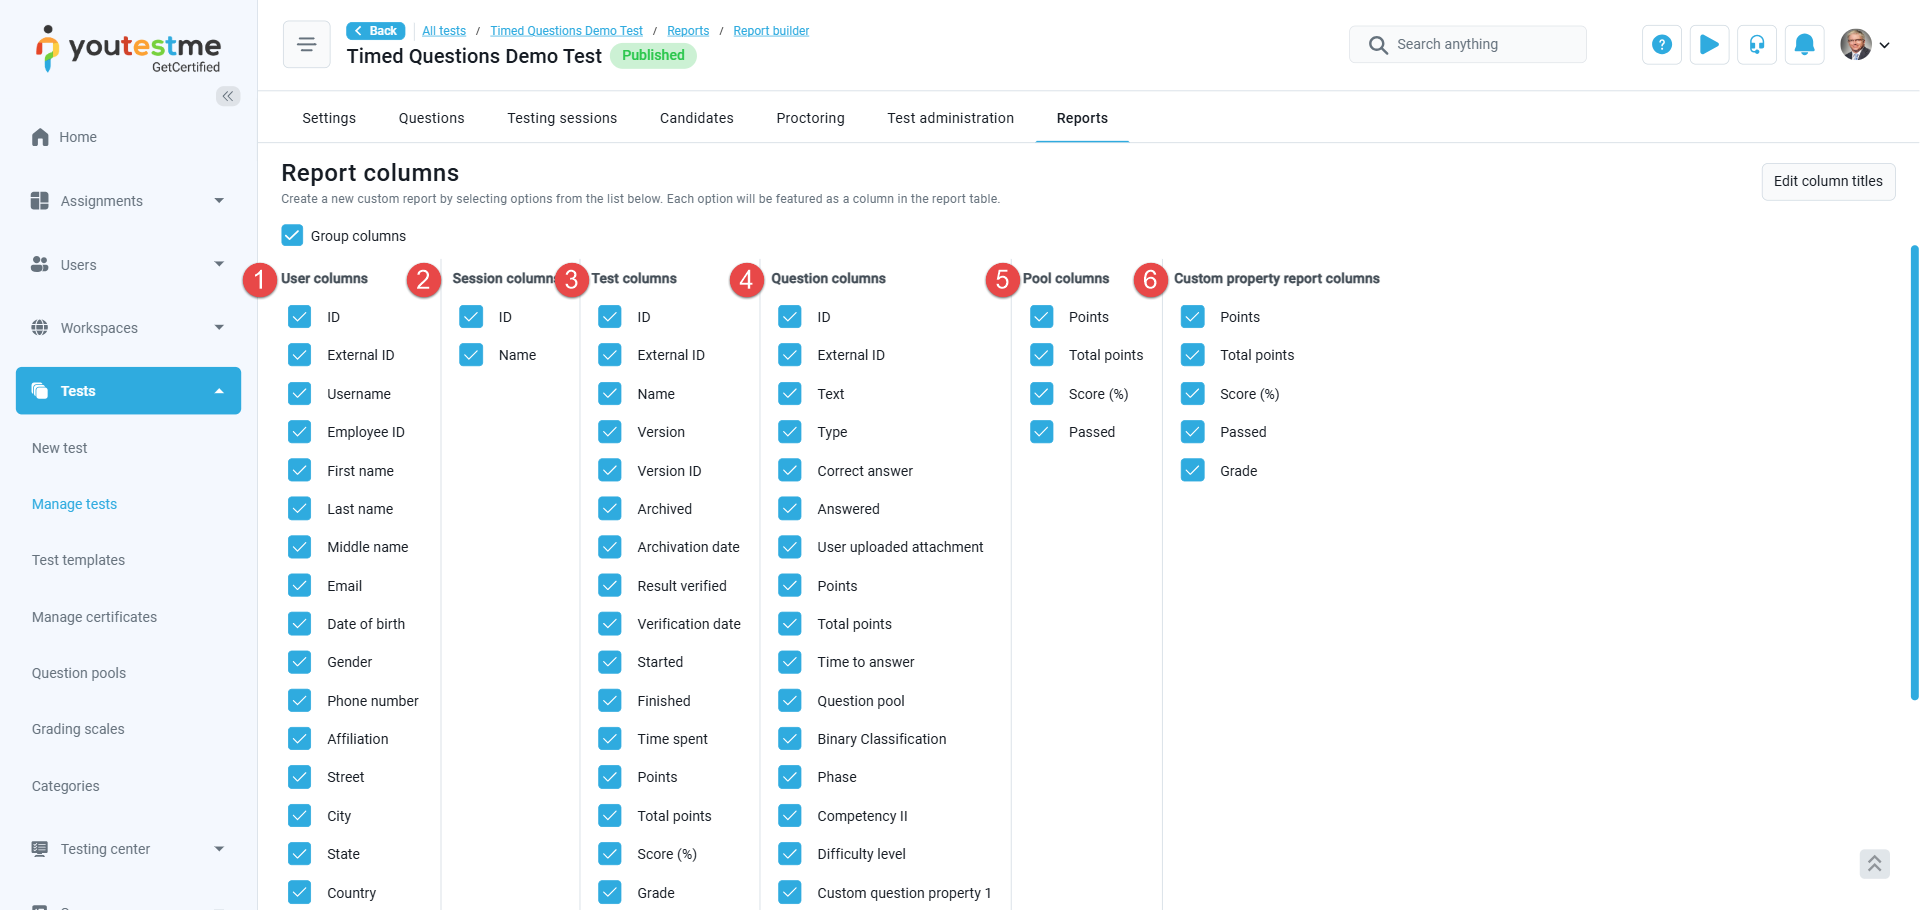
The YouTestMe Report Builder is an advanced feature that empowers users to create tailored reports in a tabular format. This tool enables customization of report content by allowing users to select specific columns for inclusion. Users can generate bespoke reports by simply selecting the desired data fields through an intuitive checkbox interface. Available column options include:
- Users: This column displays user data to be included in the report. It encompasses default user information already in the system, such as the user ID, username, external user ID, first name, last name, and any custom user data added by the administration using the custom properties feature.
- Test Session: This column contains the name and ID of the test session.
- Test: This column provides detailed exam data, including the test name and ID, its status in the system (archived or published), and the results for each test-taker. It also includes information about the status of the results (verified or not), the verification date, time spent on the test, grades, pass/fail status, total achieved points, score percentage, and the start and end times of the attempt.
- Question: This column details question-related data, such as the system ID, external ID, question text, correct answer, selected answer by the test-taker, and the points achieved per question. Additionally, any custom question labels created by the administration through the custom question properties feature will be displayed here and can be included in the report.
- Pool: This column lists the question pools used in the exam. Users can select checkboxes to include specific data in the report, such as test-taker scores per pool.
- Custom Properties: This column includes any custom report properties created by the administration, allowing for tailored exam reports. Please refer to our dedicated article.
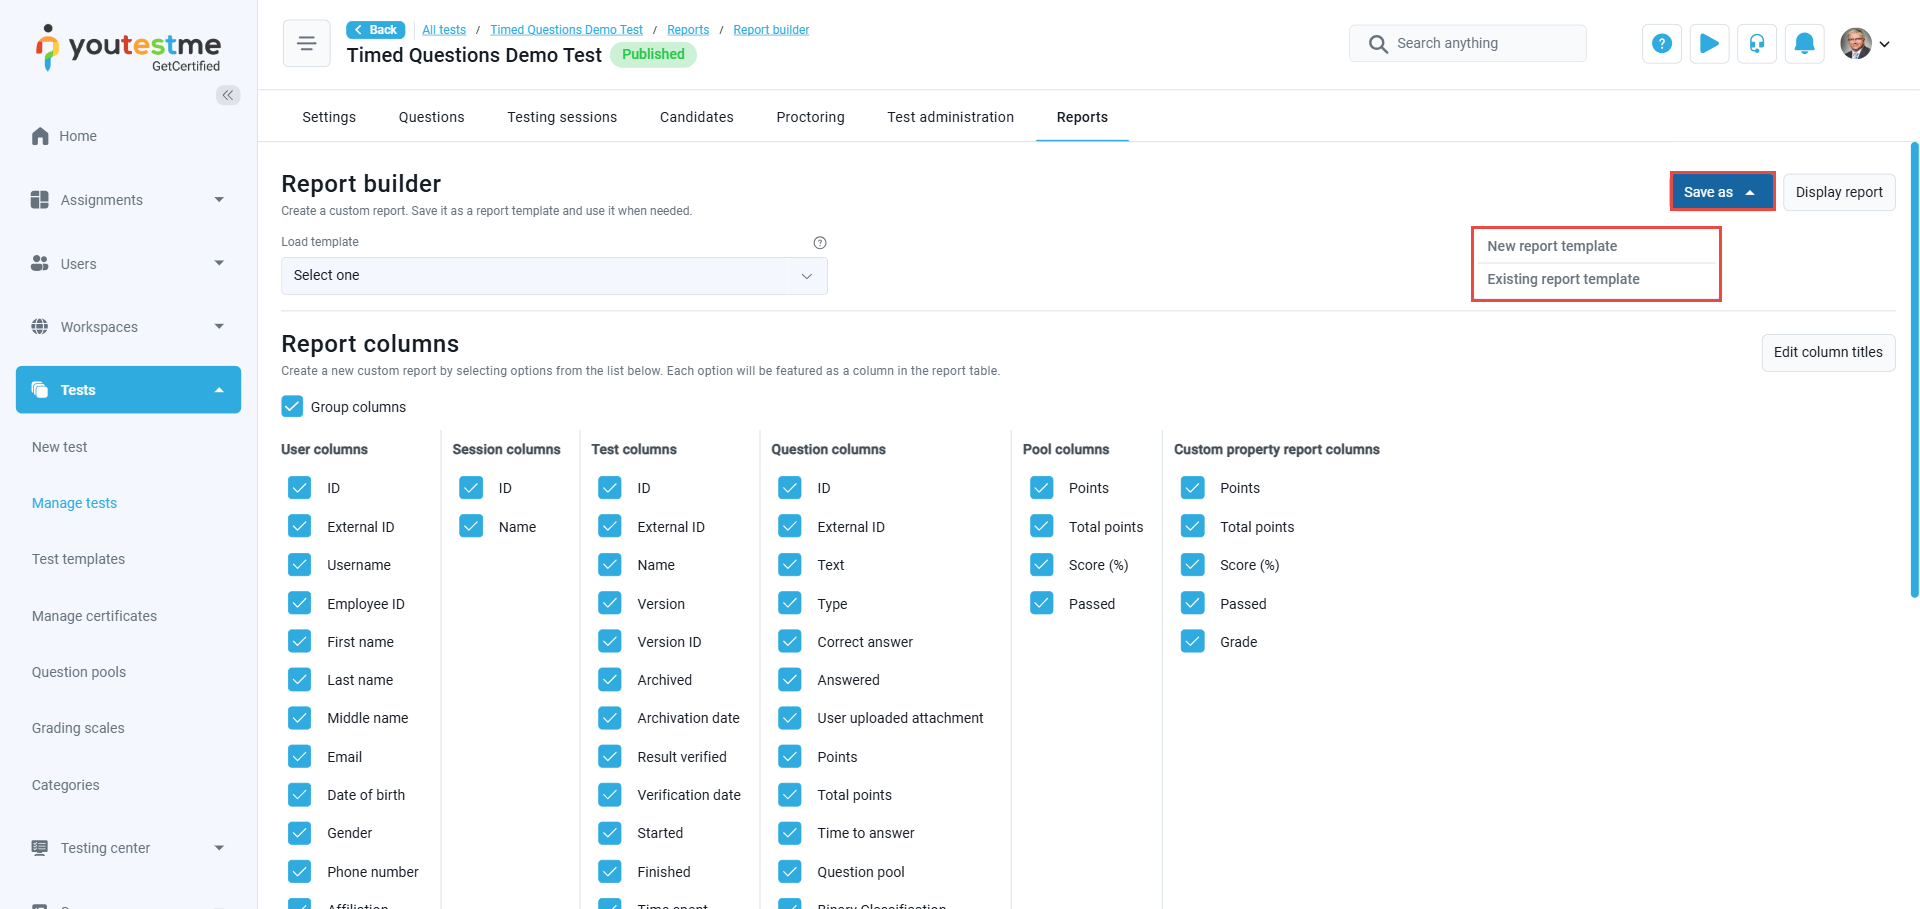
Once configured, the report can be saved as a reusable template for other exams, ensuring consistency and efficiency in reporting processes.
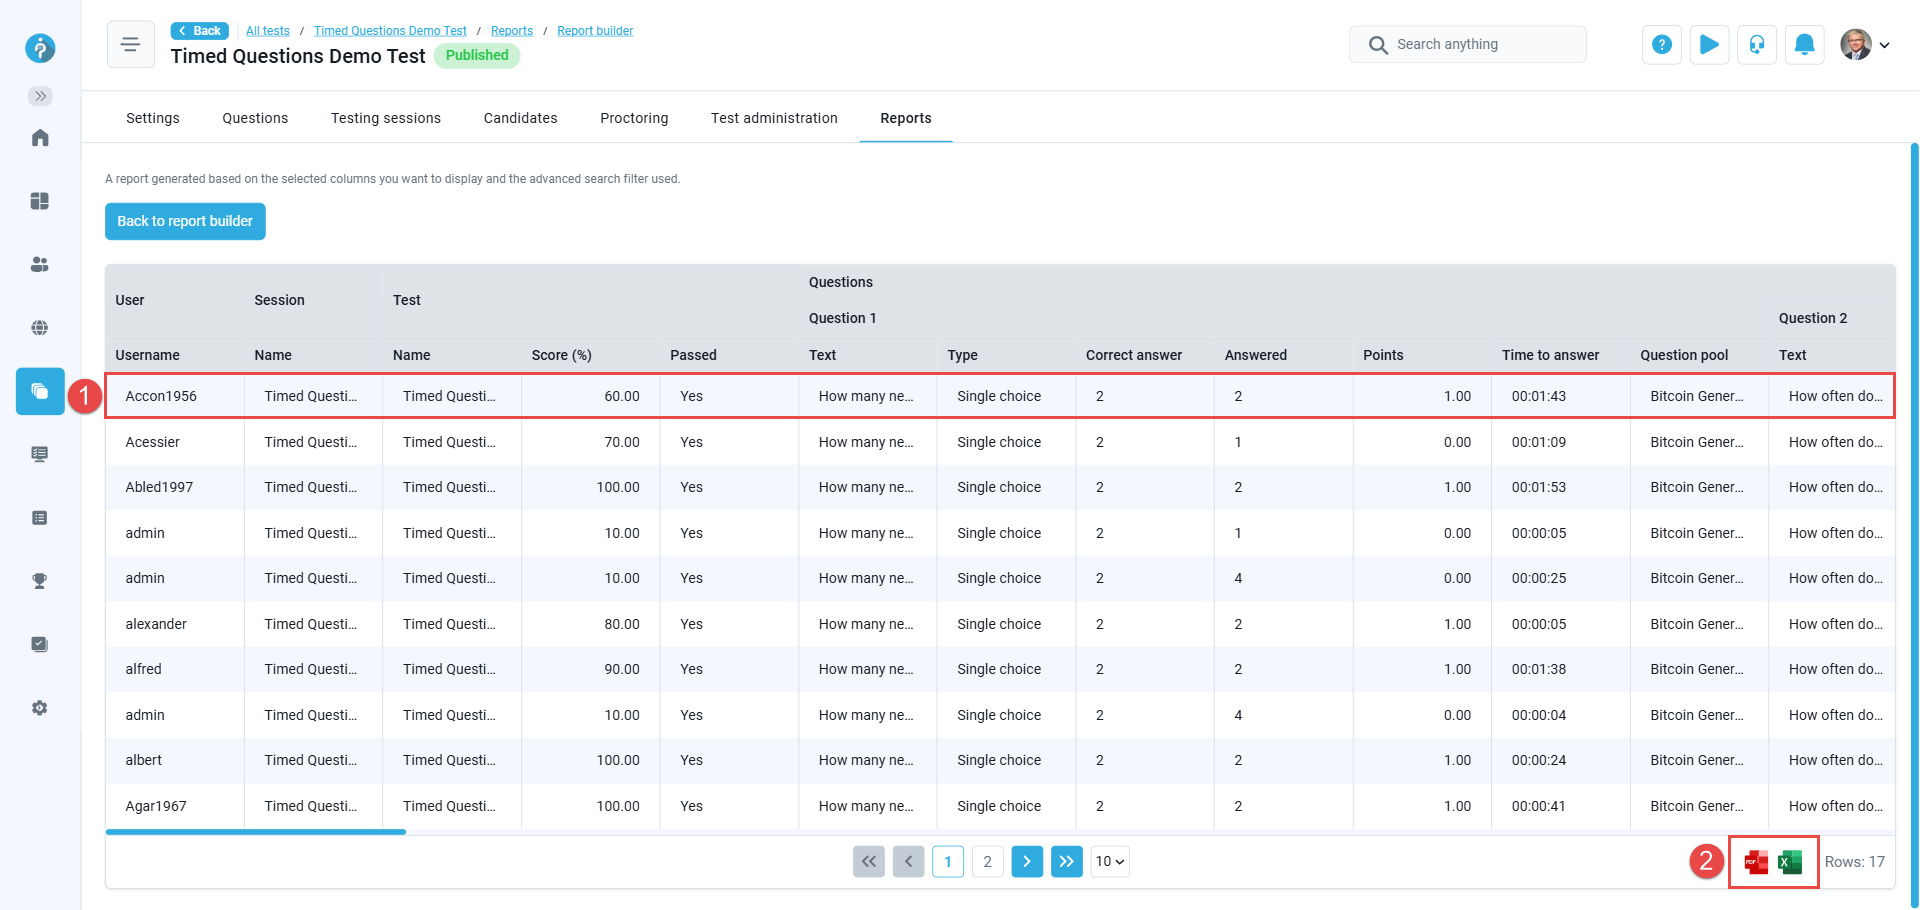
Users receive a fully customized output showcasing the selected columns and data when the report is generated using the Display Report button.
The image below illustrates an example of a report generated using the Report Builder.
- For each test-taker, the report displays the selected columns specified in the builder, providing the test creator with a comprehensive overview of all attempts, questions, and the performance of question pools.
- Reports can be downloaded in either PDF or Excel format for easy sharing and archival.
Questions Report #
Questions Report per Test #
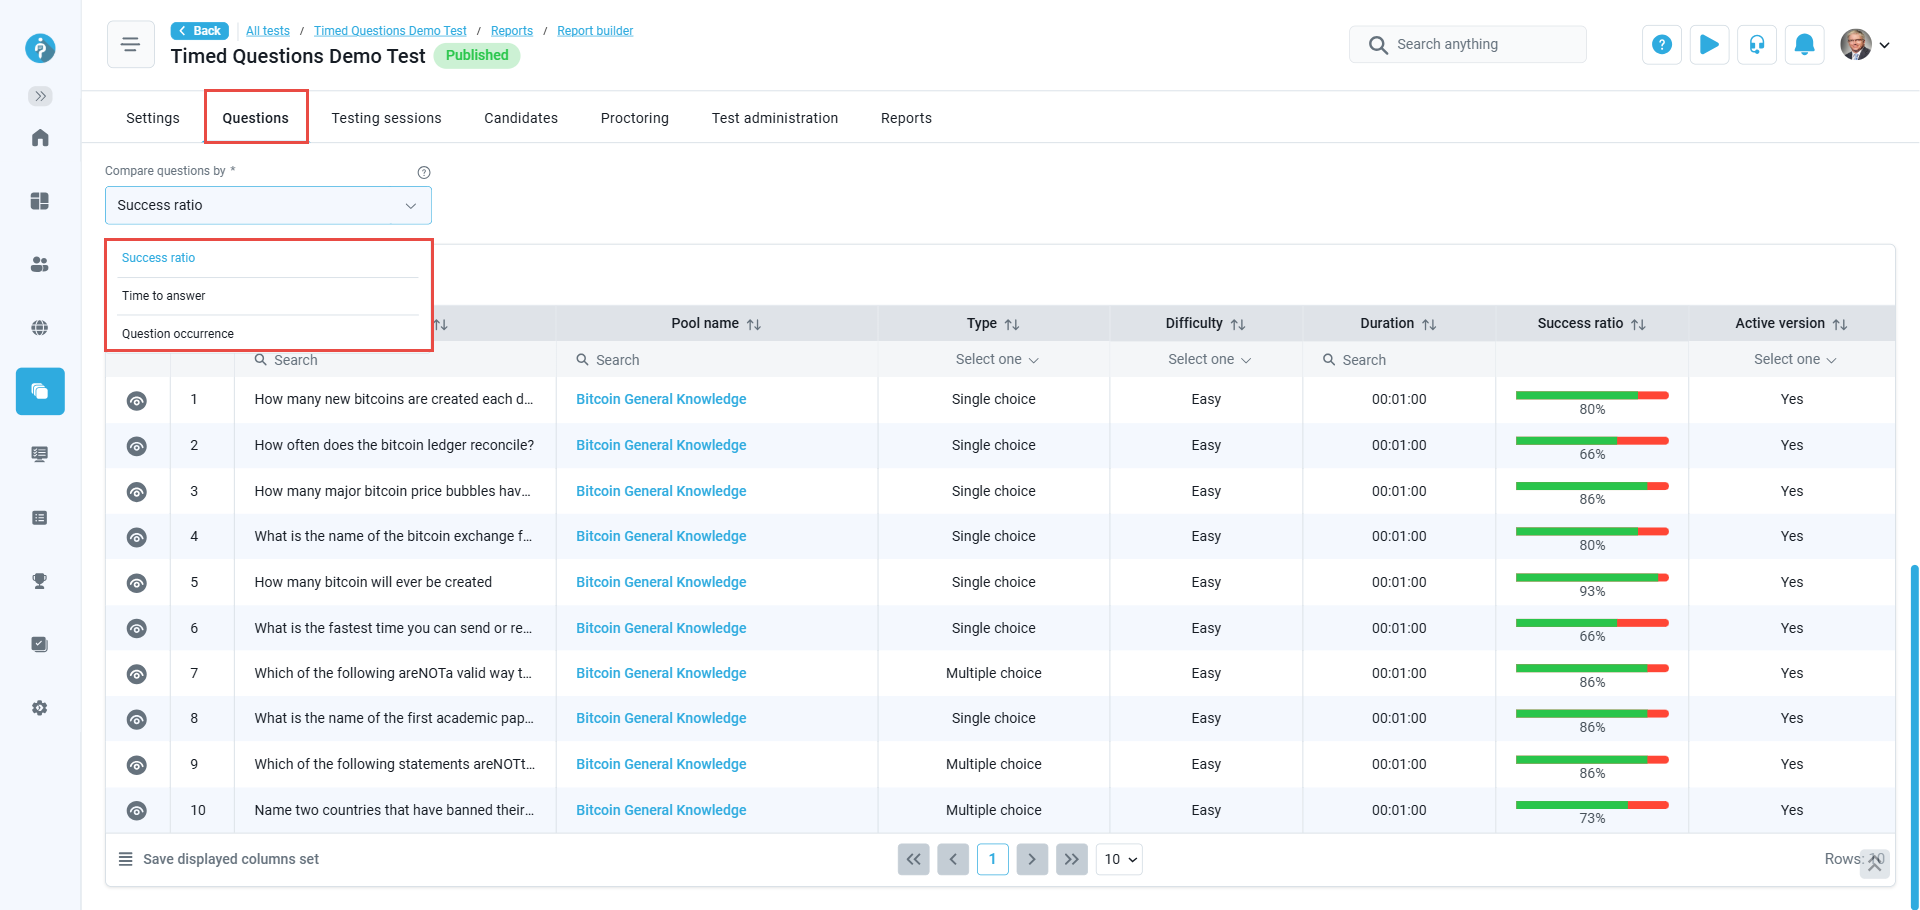
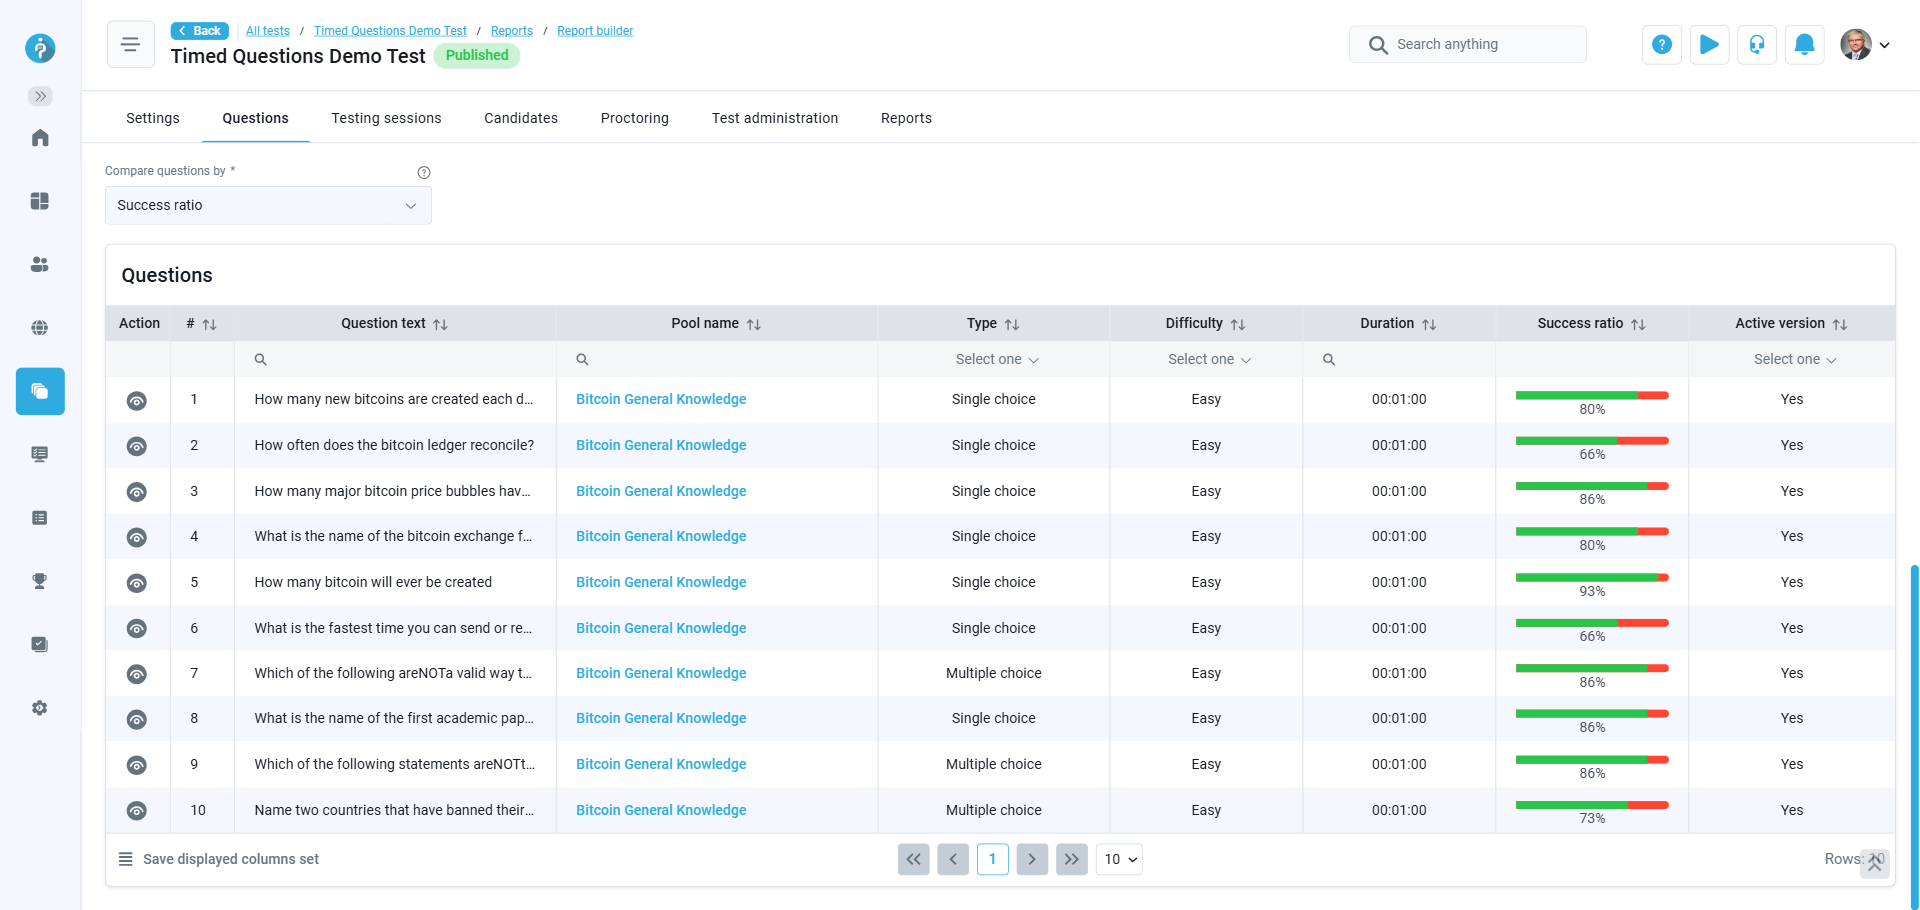
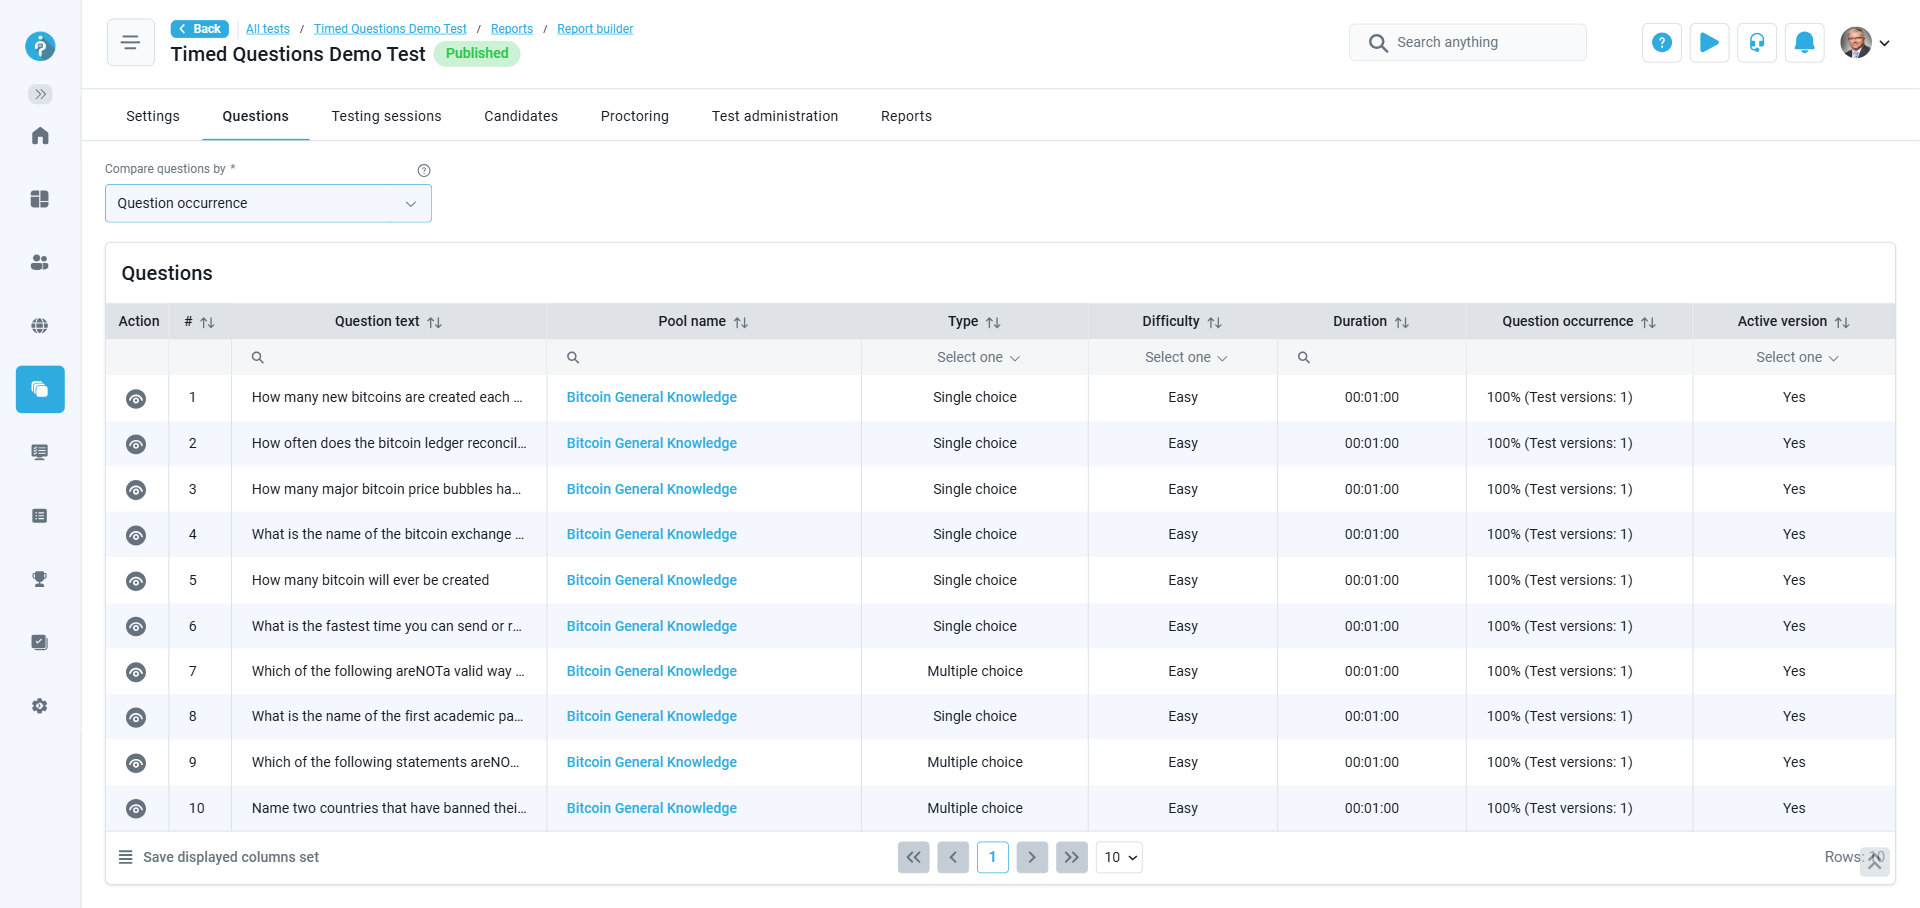
Users can access a detailed questions report through the Questions tab for each test.
This report provides:
- Success Ratio per Question and Answers: An overview of how test-takers performed on each question.
- Time Statistics per Question: Insights into the average time spent on each question.
- Question Occurrence: Data on how frequently each question appears in the test.
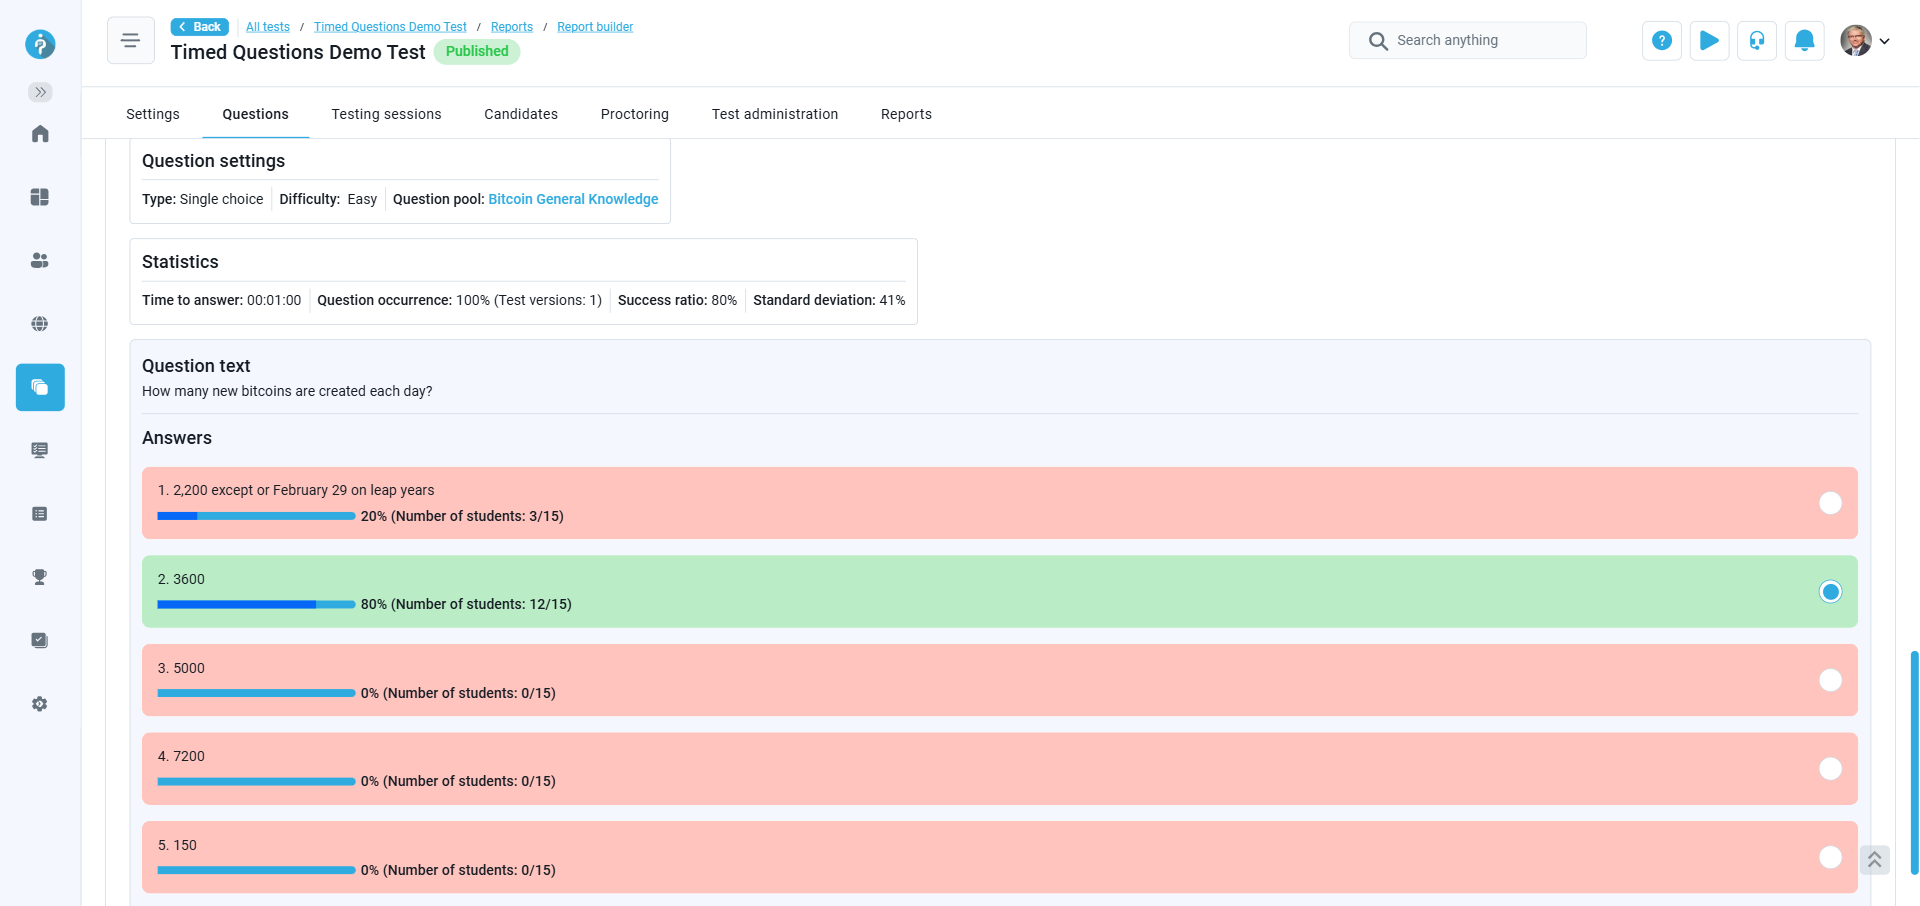
- Answers statistics: Users can view detailed statistics on the question’s answers by clicking the Details button in the Actions column for a selected question. This includes the number of correct and incorrect responses and the percentage of test-takers who selected each answer.
Questions Report per Question Pool #
In the Question Pool module, the YouTestMe system provides reports summarizing the usage of question pools across all associated tests. Key features include:
- Question Statistics
- Question Distribution
- Predefined reports
- Question Statistics: This report displays question text, difficulty level, appearance frequency, average score, response time, and more.
- Question Distribution: This report offers visual graphs analyzing the distribution of questions by type, difficulty levels, and custom properties created by users.
- Predefined reports: An easy access to a set of predefined Question reports for the selected question pool.
User groups report #
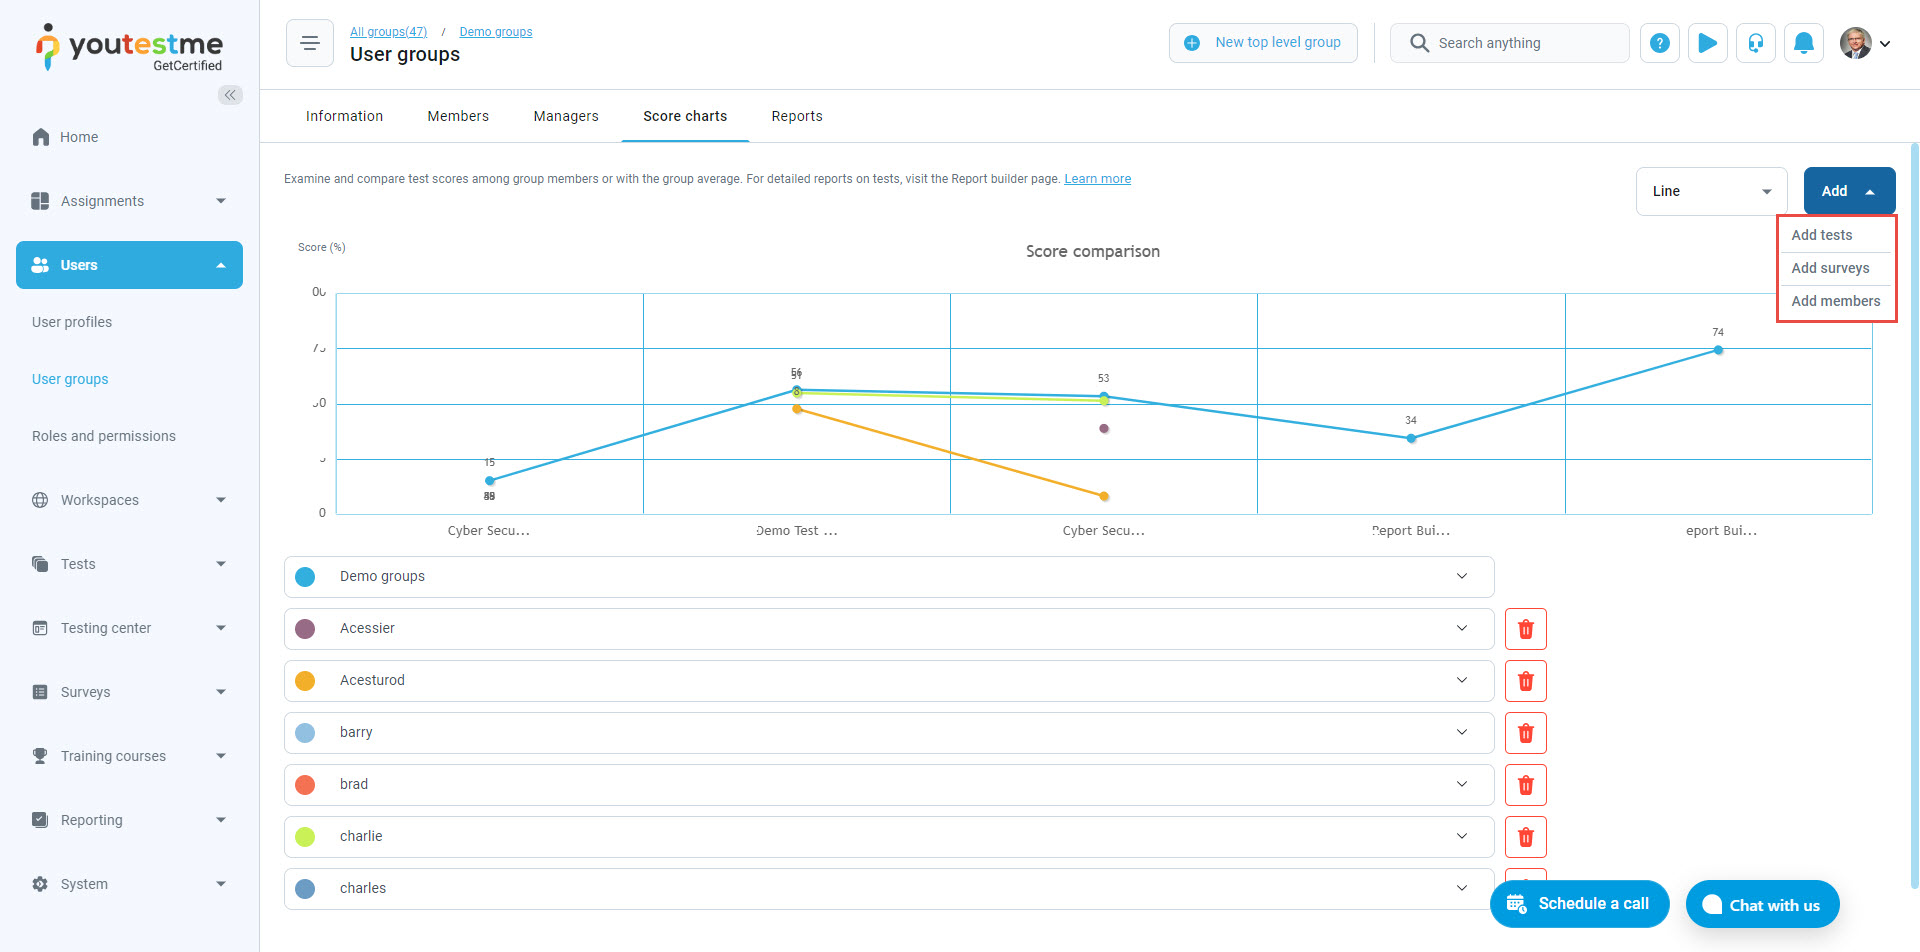
The User Groups Report allows you to analyze the performance of a specific group of users. With this report, you can visualize the group’s average performance by comparing their test scores and survey results. This makes it easier to assess the overall success of the group.
Additionally, you can dive deeper into individual performance by comparing the scores of members within the same group. This feature enables you to identify strong performers and areas where individuals may need further support or improvement.
For further guidance on how to conduct score chart analysis and make the most of this feature, please refer to this article.
Predefined reports #
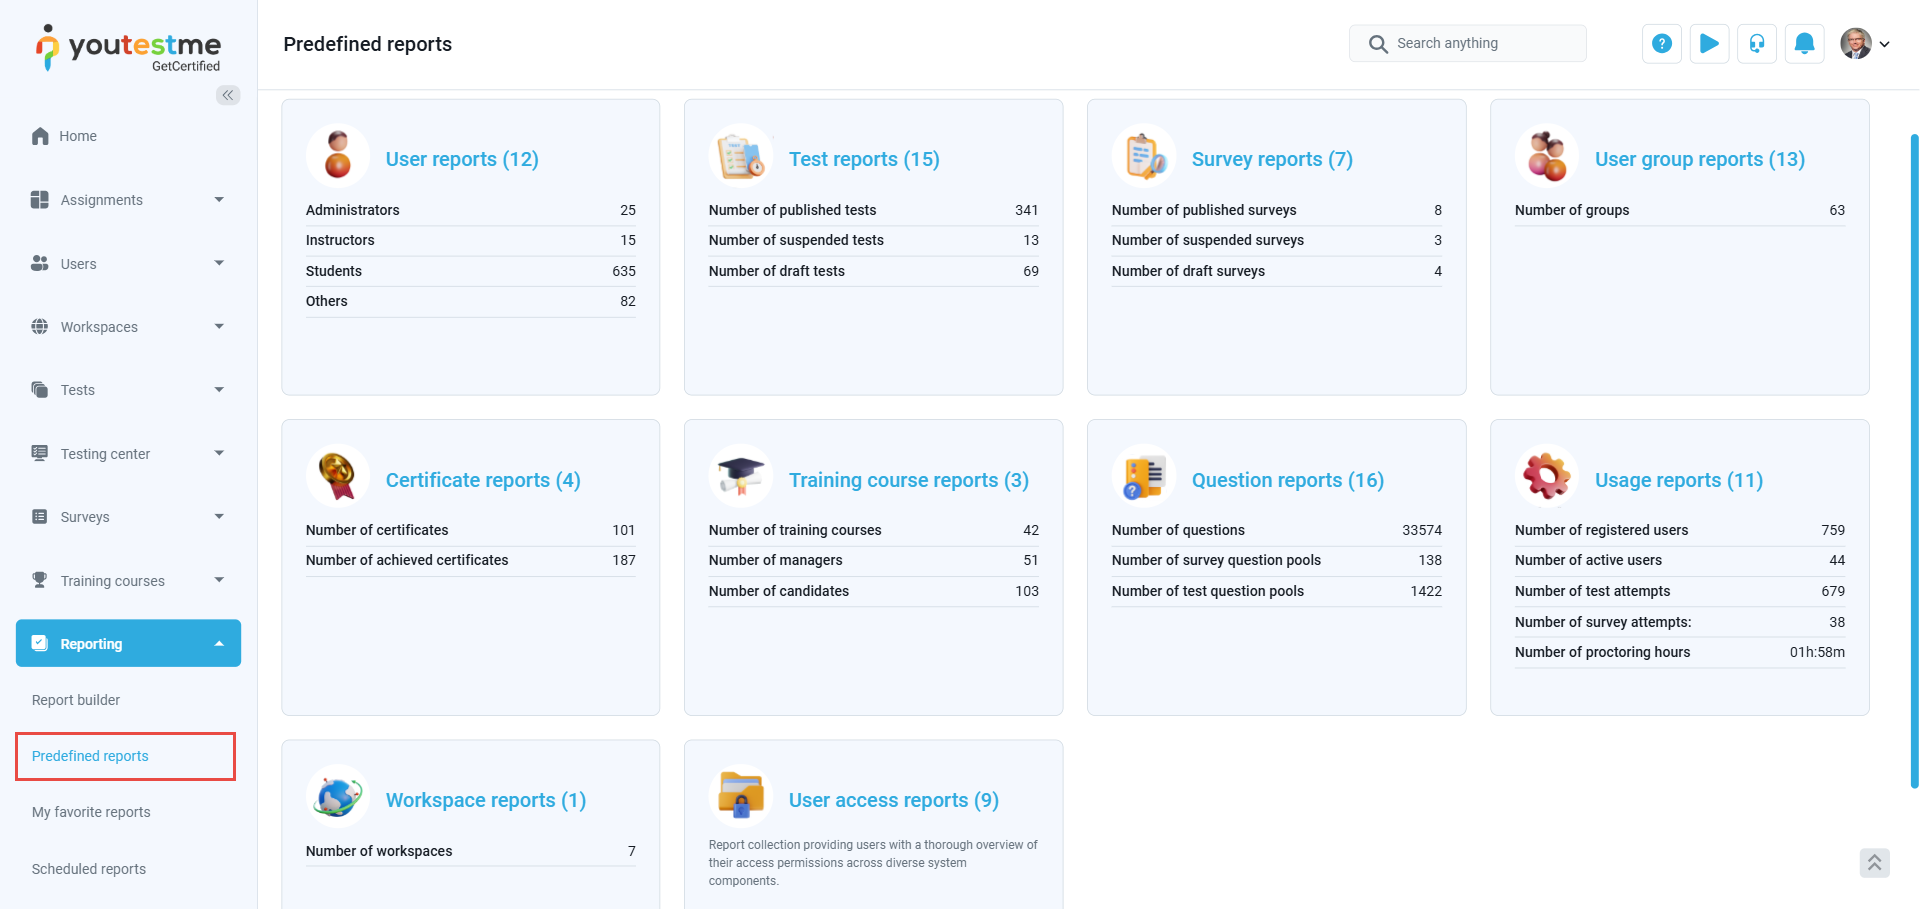
On the Predefined Reports page, you’ll find a range of pre-configured report categories. These reports are designed to offer valuable insights into test and survey performance, user activity and access, training courses, payments, registrations, and more. Key categories related to test attempts and questions include Test Reports and Question Reports.
Test Reports #
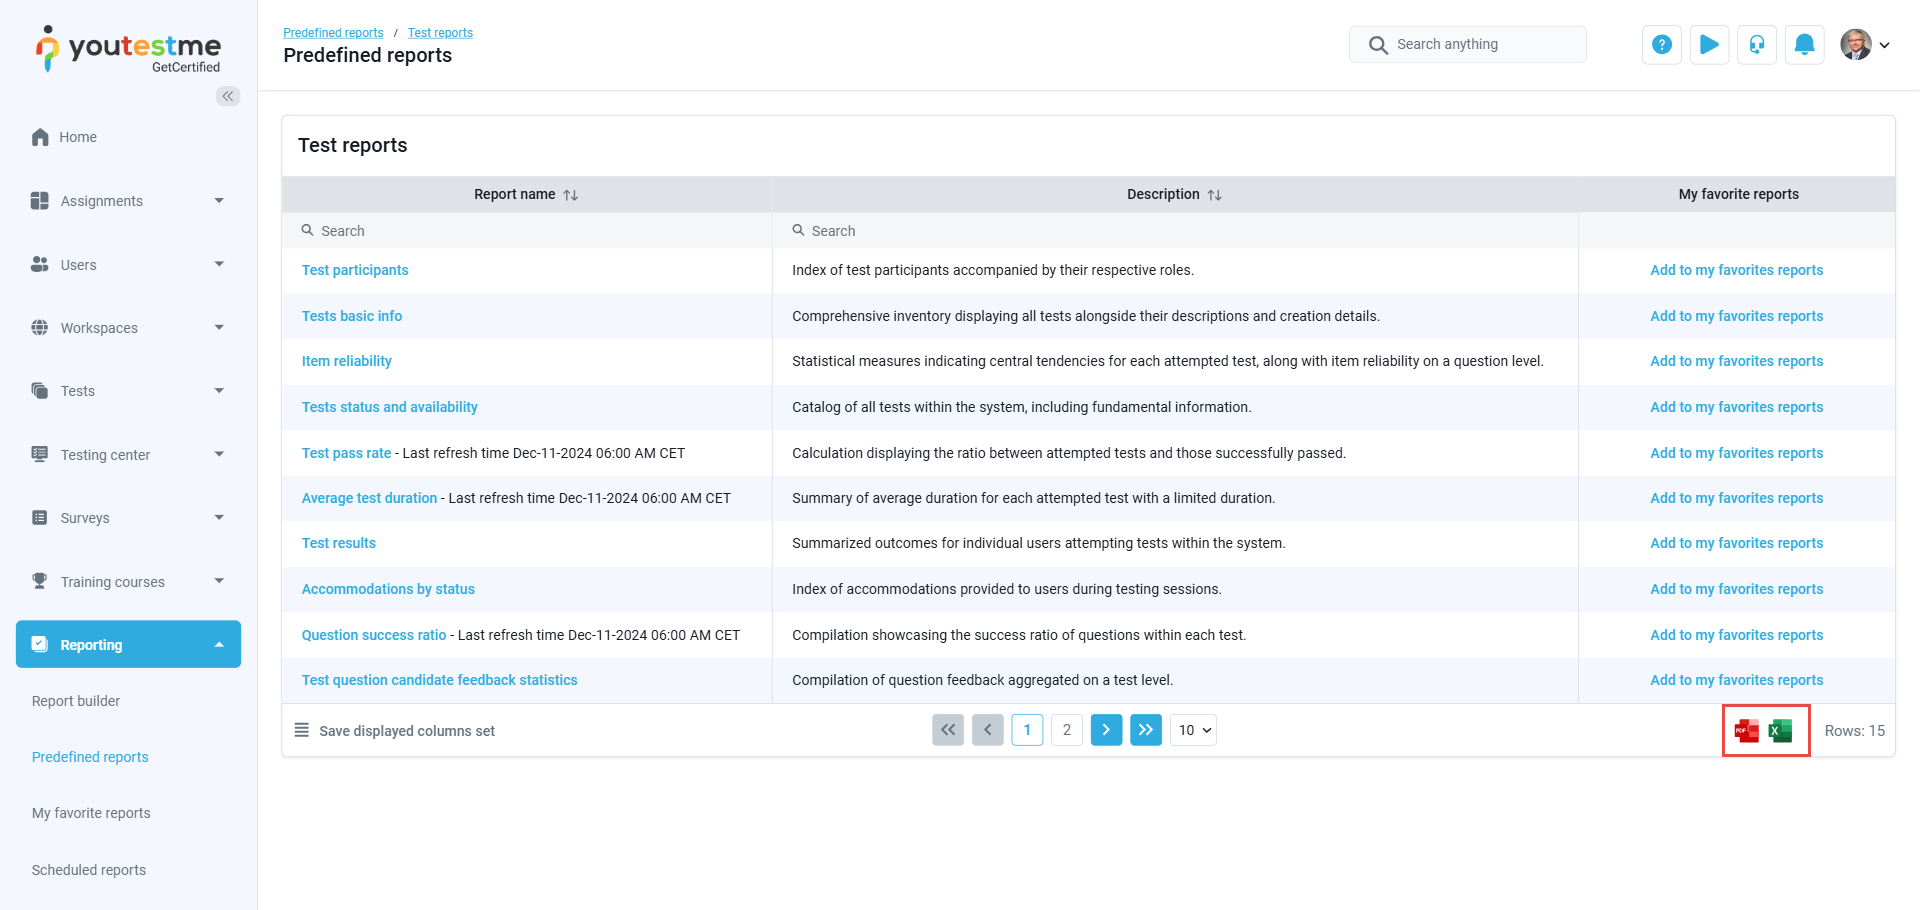
The Test Reports allow you to access, view, and download 15 detailed reports related to all tests in the system. Key elements of the test reports include:
- Item Reliability: This measure provides statistical insights into the reliability of each question within the test. It includes central tendency measures (such as mean and median) for all attempted tests, helping you understand how consistently users perform on specific items.
- Test Pass Rate: This statistic calculates the ratio between the number of tests attempted and the number of tests successfully passed. It offers a clear picture of overall success rates within a group.
- Test Results: The test results report summarizes the outcomes for individual users, showing who attempted the test and their final scores. This helps you track user progress and identify areas for improvement.
- Question Success Ratio: This compilation reveals the success ratio of each question in the test. It highlights which questions users answer correctly and which may require revision or clarification.
Note: Each listed report can be exported in PDF or Excel format.
Question Reports #
The Question Reports allow you to access, view, and download 16 detailed reports related to all Questions and question pools in the system. Key elements of the test reports include:
- Question Statistics at the Pool Level: This overview provides insights into the performance of all questions within a question pool. It helps assess the overall quality and difficulty of questions.
- Test Question Statistics: This report gives you the average score, in percentages, for each question that appeared on tests. It highlights the difficulty level of each question based on user performance, enabling you to make data-driven decisions about question design.
Note: Each listed report can be exported in PDF or Excel format.

