Article verified for Release 15.1 on December 11, 2025.
This article explains how you can generate a report on the test results for each candidate, broken down by location.
Required knowledge for understanding this article:
Previewing Testing Sessions and their Locations
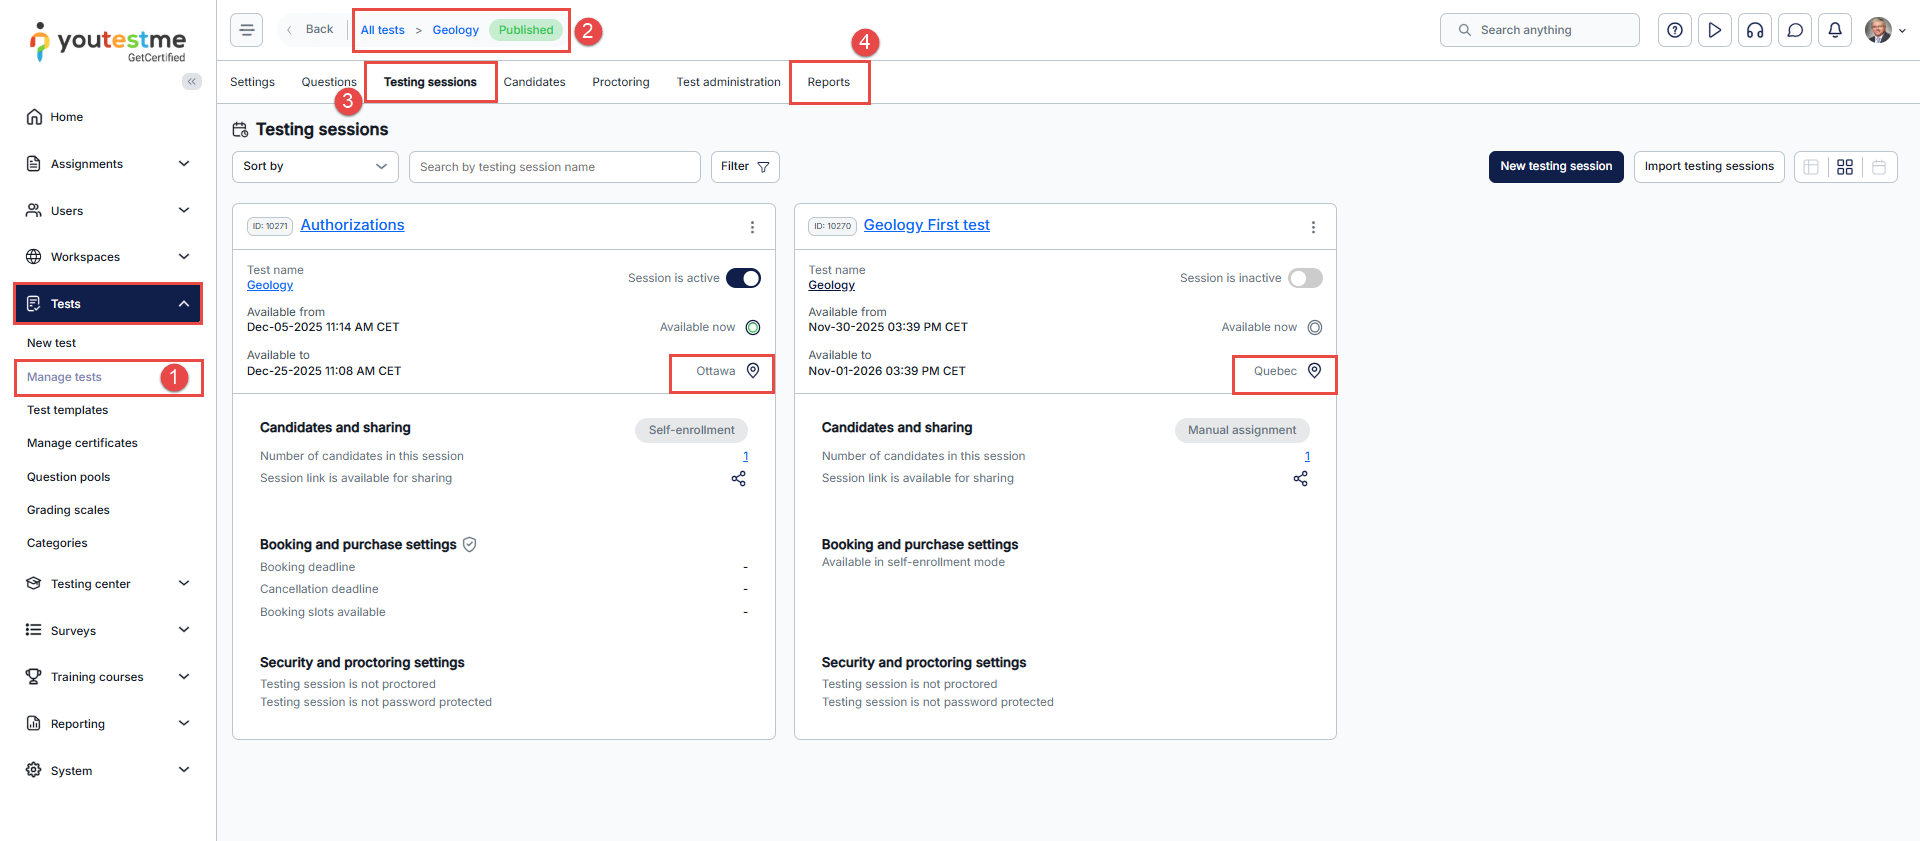
- Navigate to Tests > Manage tests
- Select the desired test.
Note: Users will only be able to see the tests they manage, and only if they have the 53. Access Report Builder permission is enabled. Without this permission, no tests will be visible. - Click the Testing sessions tab to view all sessions associated with the test and identify which of them have assigned locations. This allows you to confirm where the report will source its location data.
- Click the Reports tab to view basic information about test attempts.
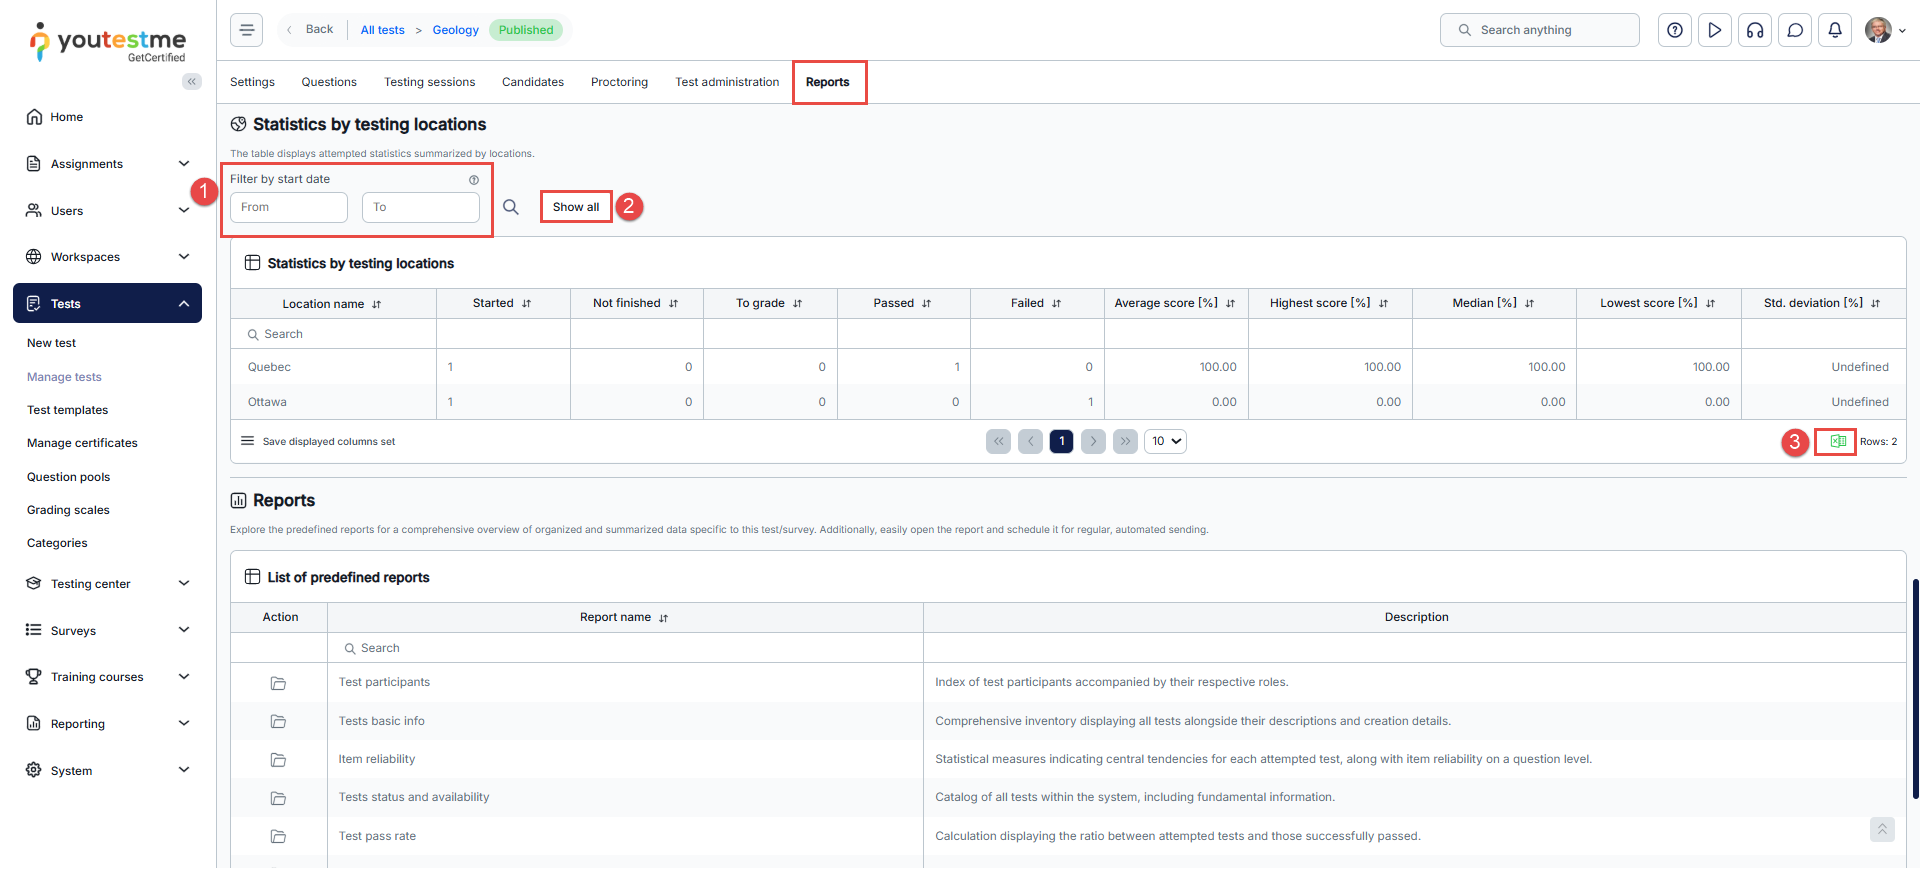
Reports tab – Statistics by Testing Locations
This report displays summarized statistics on test attempts, grouped by testing location. The table provides an overview of scores and metrics by test location.
Note: If a single location appears in multiple sessions, its total score will be aggregated and displayed accordingly.
-
Filter by Start Date: Allows you to calculate statistics for attempts that began within a specified date range. Click the magnifying glass icon to generate the report.
-
Show All: Clears any applied filters and displays all available data.
-
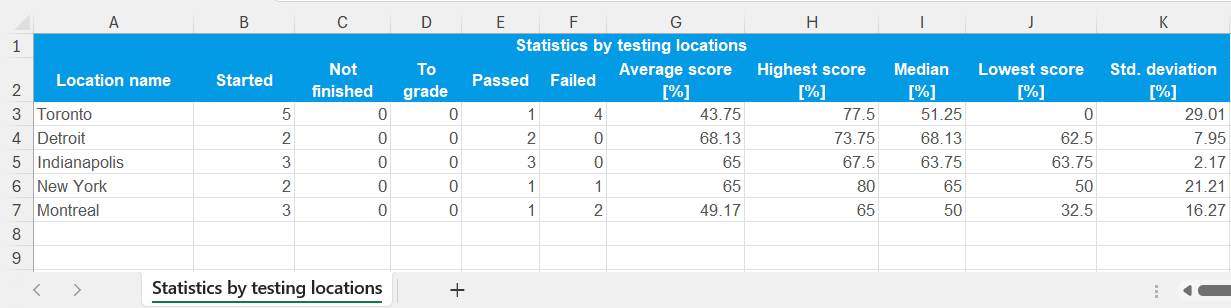
Export: Export the report in an Excel format for offline viewing or further analysis.
Example of the report exported in Excel format:
Conclusion
The Statistics by Testing Locations report provides a clear, concise overview of candidate performance by testing location. By utilizing filters and export options, test managers can effectively analyze trends, compare results across locations, and maintain organized records. This functionality is especially useful for institutions or organizations conducting assessments across multiple venues, ensuring informed decision-making and streamlined reporting.